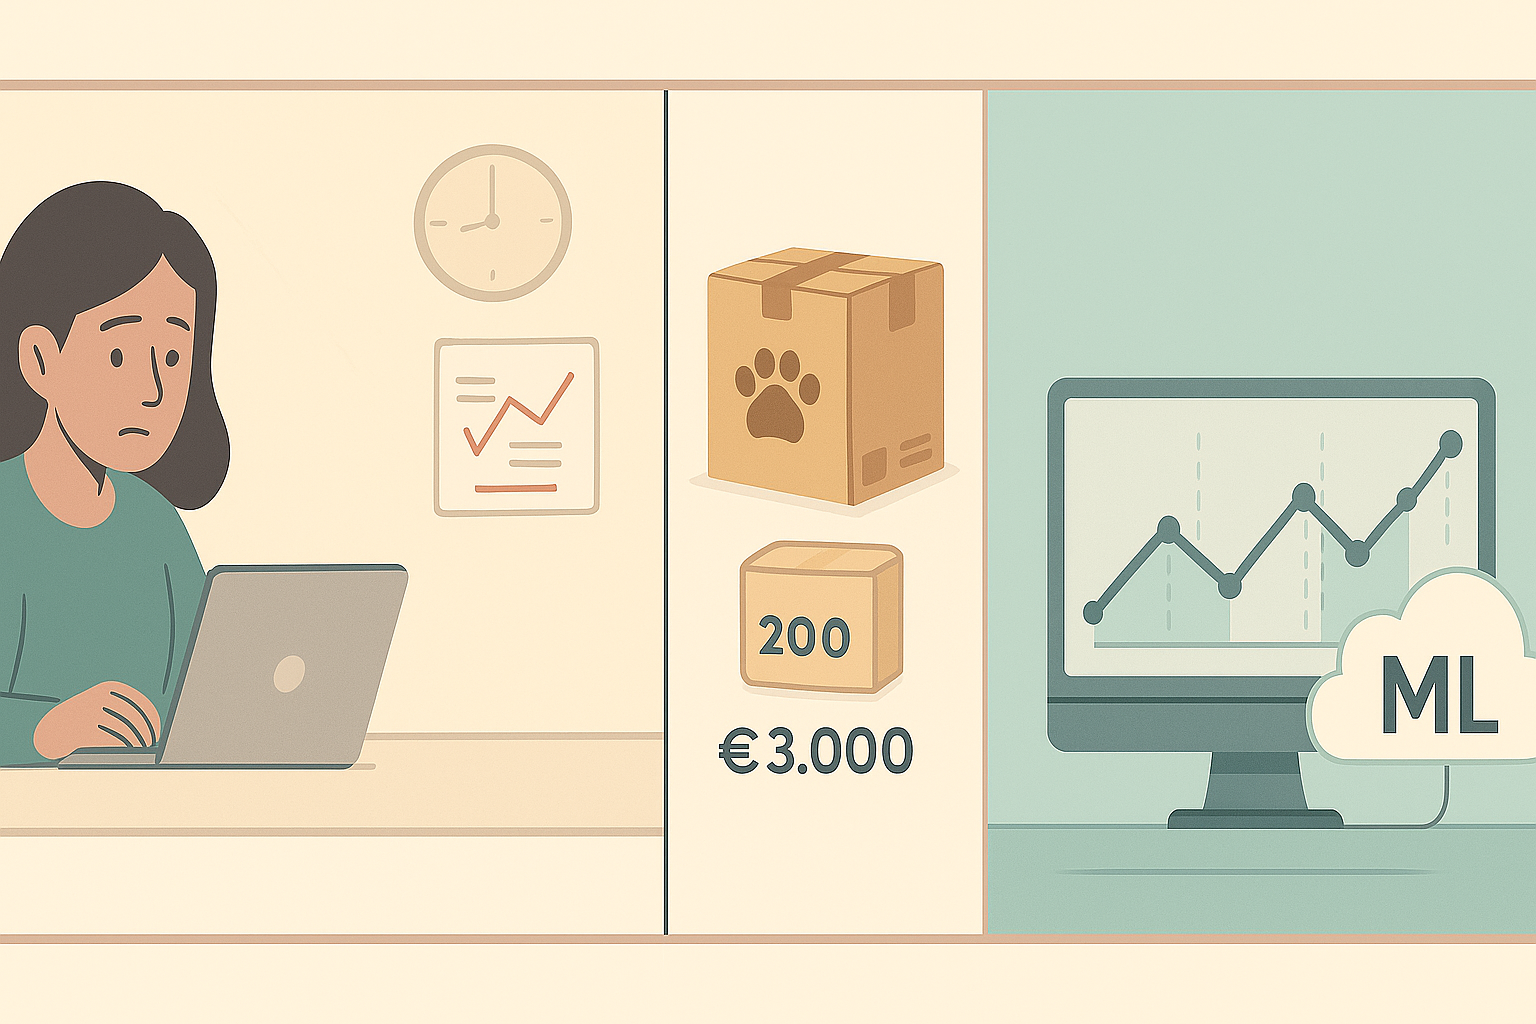
Elena, commercial director of a distribution company with 35 employees, religiously saved every sale in her master Excel file: customer, product, date, amount, salesperson, region. Three years and 15,000 rows later, that 8MB file was her most precious asset, but also her greatest frustration. She knew that inside there were patterns that could revolutionize her commercial strategy, but extracting that information took her hours of manual filters and pivot tables.
Elena's story is universal in the SME world: valuable data trapped in spreadsheets, waiting to be transformed into intelligent decisions. The AI revolution for Excel and tabular data analysis no longer requires teams of data scientists or million-dollar budgets. It's within reach of any manager who knows how to leverage the hidden power of their structured data.
What is Tabular Data and Why is it Your SME's Treasure?
Tabular data is information organized in rows and columns, like Excel spreadsheets, SQL databases, CSV files, or ERP systems. It represents 80% of all business data and is especially valuable because it's already structured and ready for automated analysis.
For an SME, tabular data includes sales records, customer lists, inventories, payrolls, accounting, digital marketing metrics, production records and any information that can be organized in tables. Modern AI can process this data to reveal invisible patterns, predict future behaviors and automate complex decisions.
The Hidden Value in Your Spreadsheets
Every cell in your Excel spreadsheets contains information that, when properly analyzed, can generate significant competitive advantages. Most SMEs dramatically underutilize the potential of their existing data.
Types of Available Insights
| Data Type | Possible Insights | Business Impact | Analysis Complexity |
|---|---|---|---|
| Historical sales | Seasonal patterns, star products | Inventory optimization | Low |
| Customer base | Automatic segmentation, lifetime value | Personalized marketing | Medium |
| Web behavior | Conversion paths, abandonments | UX optimization | Medium |
| Financial data | Cash flow prediction, profitability | Strategic planning | High |
| Operations | Efficiencies, bottlenecks | Process optimization | Medium |
| HR | Productivity patterns, retention | Talent management | High |
Information Lost by Manual Analysis
- Non-obvious correlations between variables (price vs demand, weather vs sales)
- Customer micro-segments with unique behaviors
- Complex temporal patterns beyond seasonality
- Anomalies that could indicate opportunities or problems
- Emerging trends not yet visible to the human eye
- Predictive factors for future customer behavior
According to McKinsey Global Institute (2023), SMEs that implement automated analysis of their existing tabular data increase their productivity by an average of 23% and improve their decision accuracy by 35%.
Practical Applications of AI in Tabular Data
The real revolution occurs when AI is applied to specific business problems using the data you already possess. Each department can immediately benefit from more sophisticated automated analysis.
Intelligent Customer Segmentation
AI customer segmentation goes far beyond dividing by age or geographic location. Algorithms can identify complex behavioral patterns that reveal highly specific segments with unique needs and values.
import pandas as pd
import numpy as np
from sklearn.cluster import KMeans
from sklearn.preprocessing import StandardScaler
from sklearn.decomposition import PCA
import matplotlib.pyplot as plt
import seaborn as sns

class AICustomerSegmenter:
    def __init__(self):
        self.clustering_model = None
        self.scaler = None
        self.important_features = None
        self.segment_descriptions = {}

    def prepare_customer_data(self, customer_df):
        """
        Prepares customer data for automated segmentation
        """
        # Create behavioral features
        features = customer_df.copy()

        # Customer value metrics
        features['total_value'] = features['total_purchases']
        features['purchase_frequency'] = features['num_orders']
        features['average_ticket'] = features['total_value'] / features['purchase_frequency']

        # Temporal metrics
        features['days_since_first_purchase'] = (
            pd.to_datetime('today') - pd.to_datetime(features['first_purchase_date'])
        ).dt.days

        features['days_since_last_purchase'] = (
            pd.to_datetime('today') - pd.to_datetime(features['last_purchase_date'])
        ).dt.days

        # Loyalty and engagement metrics
        features['customer_age'] = features['days_since_first_purchase'] / 365
        features['recency'] = 1 / (features['days_since_last_purchase'] + 1)
        features['purchase_intensity'] = features['purchase_frequency'] / features['customer_age']

        # Product diversity metrics
        features['product_diversity'] = features['unique_products_purchased']
        features['brand_loyalty'] = features['main_brand_purchases'] / features['purchase_frequency']

        # Seasonal metrics (if available)
        if 'q1_sales' in features.columns:
            features['seasonality'] = np.std([
                features['q1_sales'], features['q2_sales'],
                features['q3_sales'], features['q4_sales']
            ], axis=0)

        # Select numerical features for clustering
        numerical_features = [
            'total_value', 'purchase_frequency', 'average_ticket',
            'recency', 'purchase_intensity', 'product_diversity',
            'brand_loyalty', 'customer_age'
        ]

        # Filter available features
        available_features = [col for col in numerical_features if col in features.columns]

        X = features[available_features].fillna(0)

        return X, available_features

    def find_optimal_segments(self, X, max_segments=10):
        """
        Uses elbow method to find optimal number of segments
        """
        inertias = []
        K_range = range(2, max_segments + 1)

        for k in K_range:
            kmeans = KMeans(n_clusters=k, random_state=42, n_init=10)
            kmeans.fit(X)
            inertias.append(kmeans.inertia_)

        # Find "elbow" using second derivative differences
        differences = np.diff(inertias)
        second_differences = np.diff(differences)
        optimal_k = np.argmax(second_differences) + 3  # +3 because we start at k=2

        return optimal_k, inertias

    def segment_customers(self, customer_df, num_segments=None):
        """
        Performs automatic customer segmentation
        """
        # Prepare data
        X, features = self.prepare_customer_data(customer_df)

        # Normalize data
        self.scaler = StandardScaler()
        X_normalized = self.scaler.fit_transform(X)

        # Find optimal number of segments if not specified
        if num_segments is None:
            num_segments, _ = self.find_optimal_segments(X_normalized)

        # Perform clustering
        self.clustering_model = KMeans(n_clusters=num_segments, random_state=42, n_init=10)
        segments = self.clustering_model.fit_predict(X_normalized)

        # Add segments to original dataframe
        result = customer_df.copy()
        result['segment'] = segments

        # Analyze characteristics of each segment
        self.important_features = features
        self._analyze_segments(X, segments, features)

        return result

    def _analyze_segments(self, X, segments, features):
        """
        Analyzes and describes characteristics of each segment
        """
        analysis_df = X.copy()
        analysis_df['segment'] = segments

        for segment in np.unique(segments):
            segment_data = analysis_df[analysis_df['segment'] == segment]

            # Calculate segment statistics
            statistics = {
                'size': len(segment_data),
                'percentage': len(segment_data) / len(analysis_df) * 100
            }

            # Compare with global average
            for feature in features:
                if feature in segment_data.columns:
                    segment_value = segment_data[feature].mean()
                    global_value = analysis_df[feature].mean()
                    difference_pct = ((segment_value - global_value) / global_value) * 100

                    statistics[feature] = {
                        'value': segment_value,
                        'global_difference_pct': difference_pct
                    }

            # Generate automatic description
            description = self._generate_segment_description(statistics, segment)
            self.segment_descriptions[segment] = {
                'statistics': statistics,
                'description': description
            }

    def _generate_segment_description(self, statistics, segment):
        """
        Generates automatic segment description based on its characteristics
        """
        descriptions = []

        # Analyze customer value
        if 'total_value' in statistics:
            value_diff = statistics['total_value']['global_difference_pct']
            if value_diff > 50:
                descriptions.append("High value")
            elif value_diff < -30:
                descriptions.append("Low value")

        # Analyze frequency
        if 'purchase_frequency' in statistics:
            freq_diff = statistics['purchase_frequency']['global_difference_pct']
            if freq_diff > 30:
                descriptions.append("High frequency")
            elif freq_diff < -30:
                descriptions.append("Low frequency")

        # Analyze recency
        if 'recency' in statistics:
            rec_diff = statistics['recency']['global_difference_pct']
            if rec_diff > 20:
                descriptions.append("Active customers")
            elif rec_diff < -50:
                descriptions.append("Dormant customers")

        # Analyze loyalty
        if 'brand_loyalty' in statistics:
            loy_diff = statistics['brand_loyalty']['global_difference_pct']
            if loy_diff > 20:
                descriptions.append("Brand loyal")

        # Segment name based on characteristics
        if not descriptions:
            name = f"Segment {segment + 1}"
        else:
            name = " - ".join(descriptions[:2])  # Maximum 2 main characteristics

        return name

    def visualize_segments(self, X):
        """
        Creates visualizations of identified segments
        """
        if self.clustering_model is None:
            print("Must run segment_customers() first")
            return

        # Reduce dimensionality for visualization
        pca = PCA(n_components=2)
        X_pca = pca.fit_transform(self.scaler.transform(X))

        # Create segment plots
        plt.figure(figsize=(12, 8))

        # Main segment plot
        plt.subplot(2, 2, 1)
        scatter = plt.scatter(X_pca[:, 0], X_pca[:, 1],
                            c=self.clustering_model.labels_,
                            cmap='viridis', alpha=0.7)
        plt.title('Customer Segmentation (PCA)')
        plt.xlabel(f'PC1 ({pca.explained_variance_ratio_[0]:.1%} variance)')
        plt.ylabel(f'PC2 ({pca.explained_variance_ratio_[1]:.1%} variance)')
        plt.colorbar(scatter, label='Segment')

        # Segment distribution
        plt.subplot(2, 2, 2)
        unique_segments, counts = np.unique(self.clustering_model.labels_, return_counts=True)
        plt.pie(counts, labels=[f'Seg {i+1}' for i in unique_segments], autopct='%1.1f%%')
        plt.title('Segment Distribution')

        # Heatmap of features by segment
        plt.subplot(2, 1, 2)
        X_with_segments = X.copy()
        X_with_segments['segment'] = self.clustering_model.labels_

        # Calculate means by segment
        segment_means = X_with_segments.groupby('segment').mean()

        # Normalize for heatmap
        normalized_means = (segment_means - segment_means.mean()) / segment_means.std()

        sns.heatmap(normalized_means.T, annot=True, cmap='RdYlBu_r', center=0)
        plt.title('Feature Profile by Segment')
        plt.xlabel('Segment')
        plt.ylabel('Features')

        plt.tight_layout()
        plt.show()

    def generate_segmentation_report(self):
        """
        Generates detailed segmentation report
        """
        if not self.segment_descriptions:
            return "No segmentation data available"

        report = "\n=== CUSTOMER SEGMENTATION REPORT ==="

        for segment, info in self.segment_descriptions.items():
            report += f"\n\nSEGMENT {segment + 1}: {info['description']}"
            report += f"\nSize: {info['statistics']['size']} customers ({info['statistics']['percentage']:.1f}%)"

            report += "\nDistinctive characteristics:"
            for feature, data in info['statistics'].items():
                if isinstance(data, dict) and abs(data['global_difference_pct']) > 20:
                    direction = "↑" if data['global_difference_pct'] > 0 else "↓"
                    report += f"\n  • {feature}: {direction} {abs(data['global_difference_pct']):.0f}% vs average"

        return report

    def recommend_strategies(self):
        """
        Generates marketing recommendations for each segment
        """
        recommendations = {}

        for segment, info in self.segment_descriptions.items():
            strategies = []
            stats = info['statistics']

            # Value-based strategies
            if 'total_value' in stats and stats['total_value']['global_difference_pct'] > 50:
                strategies.append("VIP program with exclusive benefits")
                strategies.append("Cross-selling premium products")

            # Frequency-based strategies
            if 'purchase_frequency' in stats and stats['purchase_frequency']['global_difference_pct'] < -30:
                strategies.append("Reactivation campaigns")
                strategies.append("Volume discounts to incentivize purchases")

            # Recency-based strategies
            if 'recency' in stats and stats['recency']['global_difference_pct'] < -50:
                strategies.append("Win-back email marketing")
                strategies.append("Special 'We miss you' offers")

            recommendations[segment] = strategies if strategies else ["Generic marketing with retention focus"]

        return recommendations

# Example usage with simulated data
np.random.seed(42)

# Simulate customer base
n_customers = 1000
example_customers = pd.DataFrame({
    'customer_id': range(1, n_customers + 1),
    'total_purchases': np.random.lognormal(6, 1, n_customers),
    'num_orders': np.random.poisson(5, n_customers) + 1,
    'unique_products_purchased': np.random.poisson(3, n_customers) + 1,
    'main_brand_purchases': np.random.poisson(3, n_customers) + 1,
    'first_purchase_date': pd.date_range('2022-01-01', periods=n_customers, freq='D'),
    'last_purchase_date': pd.date_range('2024-01-01', periods=n_customers, freq='D')
})

# Create segmenter
segmenter = AICustomerSegmenter()

# Perform segmentation
segmented_customers = segmenter.segment_customers(example_customers)

# Generate reports
report = segmenter.generate_segmentation_report()
recommendations = segmenter.recommend_strategies()

print(report)
print("\n=== MARKETING RECOMMENDATIONS ===")
for segment, strategies in recommendations.items():
    print(f"\nSegment {segment + 1}:")
    for strategy in strategies:
        print(f"  • {strategy}")
Predictive Sales Analysis
AI sales data analysis transforms historical records into accurate predictions about future market behavior, enabling proactive rather than reactive planning.
- Demand prediction by product and region 3-6 months in advance
- Identification of products with growth or decline potential
- Price optimization based on AI-detected demand elasticity
- Early detection of changes in customer preferences
- Revenue forecasting with confidence intervals for financial planning
Marketing and Campaign Optimization
| Application | Required Data | Expected Benefit | Implementation |
|---|---|---|---|
| Personalized targeting | Purchase history, demographics | 30-50% better CTR | 2-4 weeks |
| Channel optimization | Conversions by channel, costs | 25-40% better ROI | 3-6 weeks |
| Campaign timing | Temporal purchase patterns | 20-35% more sales | 1-3 weeks |
| Dynamic pricing | Elasticity, competition | 15-25% more margin | 4-8 weeks |
| Churn prediction | Transactional behavior | 60-80% churn reduction | 6-10 weeks |
The Intelligence Extraction Process
Transforming tabular data into business intelligence for SMEs follows a structured process that can be almost completely automated, reducing analysis time from days to minutes.
Phase 1: Extraction and Consolidation
Most SMEs have data distributed across multiple systems: Excel, CRM, ERP, digital marketing tools, accounting. The first step is to consolidate this information into a unified view.
import pandas as pd
import numpy as np
from sqlalchemy import create_engine
import requests
from datetime import datetime, timedelta

class SMEDataExtractor:
    def __init__(self):
        self.consolidated_data = {}
        self.metadata = {}

    def extract_multiple_excel(self, excel_files):
        """
        Extracts and consolidates data from multiple Excel files
        """
        combined_data = {}

        for file_name, config in excel_files.items():
            try:
                # Read Excel with specific configuration
                df = pd.read_excel(
                    config['path'],
                    sheet_name=config.get('sheet', 0),
                    header=config.get('header_row', 0)
                )

                # Clean column names
                df.columns = df.columns.str.strip().str.lower().str.replace(' ', '_')

                # Add source metadata
                df['data_source'] = file_name
                df['extraction_date'] = datetime.now()

                combined_data[file_name] = df

                print(f"✅ Extracted {file_name}: {len(df)} rows, {len(df.columns)} columns")

            except Exception as e:
                print(f"❌ Error extracting {file_name}: {str(e)}")

        return combined_data

    def extract_database(self, connection_string, queries):
        """
        Extracts data from SQL database
        """
        engine = create_engine(connection_string)
        db_data = {}

        for query_name, sql in queries.items():
            try:
                df = pd.read_sql(sql, engine)
                df['data_source'] = 'database'
                df['extraction_date'] = datetime.now()

                db_data[query_name] = df
                print(f"✅ Query {query_name}: {len(df)} records")

            except Exception as e:
                print(f"❌ Error in query {query_name}: {str(e)}")

        return db_data

    def extract_marketing_api(self, api_configurations):
        """
        Extracts data from marketing APIs (Google Analytics, Facebook, etc.)
        """
        marketing_data = {}

        for platform, config in api_configurations.items():
            if platform == 'google_analytics':
                marketing_data[platform] = self._extract_google_analytics(config)
            elif platform == 'facebook_ads':
                marketing_data[platform] = self._extract_facebook_ads(config)
            # Add more platforms as needed

        return marketing_data

    def _extract_google_analytics(self, config):
        """
        Simulates Google Analytics extraction
        (In real implementation, use Google Analytics Reporting API)
        """
        # GA data simulation
        dates = pd.date_range(
            start=datetime.now() - timedelta(days=90),
            end=datetime.now(),
            freq='D'
        )

        df = pd.DataFrame({
            'date': dates,
            'sessions': np.random.poisson(100, len(dates)),
            'users': np.random.poisson(80, len(dates)),
            'conversions': np.random.poisson(5, len(dates)),
            'revenue': np.random.normal(500, 100, len(dates))
        })

        df['data_source'] = 'google_analytics'
        return df

    def _extract_facebook_ads(self, config):
        """
        Simulates Facebook Ads extraction
        """
        dates = pd.date_range(
            start=datetime.now() - timedelta(days=30),
            end=datetime.now(),
            freq='D'
        )

        df = pd.DataFrame({
            'date': dates,
            'impressions': np.random.poisson(1000, len(dates)),
            'clicks': np.random.poisson(50, len(dates)),
            'spend': np.random.normal(25, 5, len(dates)),
            'conversions': np.random.poisson(2, len(dates))
        })

        df['data_source'] = 'facebook_ads'
        return df

    def consolidate_data(self, all_sources):
        """
        Consolidates data from multiple sources into unified structures
        """
        consolidated = {
            'sales': [],
            'customers': [],
            'marketing': [],
            'financial': []
        }

        for source, data in all_sources.items():
            for table, df in data.items():
                # Classify data by type
                if any(col in df.columns for col in ['sale', 'order', 'invoice']):
                    consolidated['sales'].append(df)
                elif any(col in df.columns for col in ['client', 'customer', 'user']):
                    consolidated['customers'].append(df)
                elif any(col in df.columns for col in ['impressions', 'clicks', 'conversion']):
                    consolidated['marketing'].append(df)
                elif any(col in df.columns for col in ['amount', 'price', 'cost']):
                    consolidated['financial'].append(df)

        # Combine DataFrames for each category
        for category, df_list in consolidated.items():
            if df_list:
                try:
                    combined_df = pd.concat(df_list, ignore_index=True, sort=False)
                    consolidated[category] = combined_df
                    print(f"✅ Consolidated {category}: {len(combined_df)} records")
                except Exception as e:
                    print(f"❌ Error consolidating {category}: {str(e)}")
                    consolidated[category] = pd.DataFrame()
            else:
                consolidated[category] = pd.DataFrame()

        self.consolidated_data = consolidated
        return consolidated

    def generate_quality_report(self):
        """
        Generates consolidated data quality report
        """
        report = "\n=== DATA QUALITY REPORT ==="

        for category, df in self.consolidated_data.items():
            if len(df) > 0:
                report += f"\n\n{category.upper()}:"
                report += f"\n  • Records: {len(df):,}"
                report += f"\n  • Columns: {len(df.columns)}"
                report += f"\n  • Missing values: {df.isnull().sum().sum():,} ({df.isnull().sum().sum()/df.size*100:.1f}%)"
                report += f"\n  • Duplicates: {df.duplicated().sum():,}"

                # Data period
                date_cols = [col for col in df.columns if 'date' in col.lower()]
                if date_cols:
                    date_col = date_cols[0]
                    try:
                        df[date_col] = pd.to_datetime(df[date_col])
                        min_date = df[date_col].min()
                        max_date = df[date_col].max()
                        report += f"\n  • Period: {min_date.date()} to {max_date.date()}"
                    except:
                        pass

        return report

# Example configuration for extraction
example_config = {
    'excel_files': {
        'sales': {
            'path': 'sales_2024.xlsx',
            'sheet': 'Data',
            'header_row': 0
        },
        'customers': {
            'path': 'customer_base.xlsx',
            'sheet': 'Customers',
            'header_row': 1
        }
    },
    'marketing_apis': {
        'google_analytics': {
            'property_id': 'GA_PROPERTY_ID',
            'credentials': 'path/to/credentials.json'
        },
        'facebook_ads': {
            'access_token': 'FB_ACCESS_TOKEN',
            'account_id': 'FB_ACCOUNT_ID'
        }
    }
}

# Using the extractor
extractor = SMEDataExtractor()

# Simulate extraction (in real case, use actual files and APIs)
excel_data = {
    'sales': pd.DataFrame({
        'date': pd.date_range('2024-01-01', periods=100),
        'customer_id': np.random.randint(1, 50, 100),
        'product': np.random.choice(['A', 'B', 'C'], 100),
        'quantity': np.random.randint(1, 10, 100),
        'price': np.random.normal(50, 10, 100)
    }),
    'customers': pd.DataFrame({
        'customer_id': range(1, 51),
        'name': [f'Customer {i}' for i in range(1, 51)],
        'segment': np.random.choice(['Premium', 'Standard', 'Basic'], 50)
    })
}

marketing_data = {
    'google_analytics': extractor._extract_google_analytics({}),
    'facebook_ads': extractor._extract_facebook_ads({})
}

# Consolidate all sources
all_sources = {
    'excel': excel_data,
    'marketing': marketing_data
}

consolidated_data = extractor.consolidate_data(all_sources)
quality_report = extractor.generate_quality_report()

print(quality_report)
Phase 2: Cleaning and Normalization
Extracted data is rarely ready for analysis. Automated cleaning identifies and corrects inconsistencies, missing values, duplicates, and anomalies that could bias results.
- Automatic outlier detection using statistical methods
- Intelligent imputation of missing values based on patterns
- Format normalization (dates, numbers, text)
- Intelligent identification and elimination of duplicates
- Referential integrity validation between tables
- Automatic enrichment with external data (postal codes, etc.)
Phase 3: Automated Analysis
This phase applies AI algorithms to discover patterns, correlations, and insights that would be impossible to detect manually, especially in datasets with multiple variables.
import pandas as pd
import numpy as np
from sklearn.ensemble import RandomForestRegressor, IsolationForest
from sklearn.preprocessing import LabelEncoder
from sklearn.model_selection import train_test_split
from sklearn.metrics import mean_absolute_error, r2_score
import matplotlib.pyplot as plt
import seaborn as sns
from scipy import stats

class AutomaticAnalyzer:
    def __init__(self):
        self.insights = []
        self.important_correlations = []
        self.predictive_models = {}
        self.detected_anomalies = []

    def automatic_exploratory_analysis(self, df, target=None):
        """
        Performs automatic exploratory data analysis of tabular data
        """
        insights = []

        # Basic dataset information
        insights.append(f"Dataset: {len(df)} rows, {len(df.columns)} columns")

        # Data types analysis
        numeric = df.select_dtypes(include=[np.number]).columns.tolist()
        categorical = df.select_dtypes(include=['object']).columns.tolist()

        insights.append(f"Numeric variables: {len(numeric)}")
        insights.append(f"Categorical variables: {len(categorical)}")

        # Detect missing values
        missing_pct = (df.isnull().sum() / len(df) * 100).round(2)
        missing_variables = missing_pct[missing_pct > 0].sort_values(ascending=False)

        if len(missing_variables) > 0:
            insights.append(f"Variables with missing data: {len(missing_variables)}")
            for var, pct in missing_variables.head(3).items():
                insights.append(f"  • {var}: {pct}% missing")

        # Distribution analysis
        for col in numeric[:5]:  # Analyze top 5 numeric variables
            skewness = stats.skew(df[col].dropna())
            if abs(skewness) > 1:
                direction = "positive" if skewness > 0 else "negative"
                insights.append(f"Variable '{col}' has {direction} skewness (skew: {skewness:.2f})")

        # Detect variables with low variance
        for col in numeric:
            cv = df[col].std() / df[col].mean() if df[col].mean() != 0 else 0
            if cv < 0.1:
                insights.append(f"Variable '{col}' has low variability (CV: {cv:.3f})")

        # Cardinality analysis for categorical variables
        for col in categorical:
            unique_count = df[col].nunique()
            total_count = len(df[col].dropna())
            if unique_count / total_count > 0.5:
                insights.append(f"Variable '{col}' has high cardinality ({unique_count} unique values)")

        return insights

    def detect_important_correlations(self, df, threshold=0.7):
        """
        Detects strong correlations between variables
        """
        numeric = df.select_dtypes(include=[np.number]).columns

        if len(numeric) < 2:
            return []

        corr_matrix = df[numeric].corr()
        correlations = []

        # Find strong correlations
        for i in range(len(corr_matrix.columns)):
            for j in range(i+1, len(corr_matrix.columns)):
                var1 = corr_matrix.columns[i]
                var2 = corr_matrix.columns[j]
                corr_val = corr_matrix.iloc[i, j]

                if abs(corr_val) >= threshold:
                    correlations.append({
                        'variable_1': var1,
                        'variable_2': var2,
                        'correlation': corr_val,
                        'strength': 'Very strong' if abs(corr_val) >= 0.9 else 'Strong'
                    })

        # Sort by correlation strength
        correlations.sort(key=lambda x: abs(x['correlation']), reverse=True)

        self.important_correlations = correlations
        return correlations

    def detect_anomalies(self, df, contamination=0.1):
        """
        Detects anomalies in data using Isolation Forest
        """
        numeric = df.select_dtypes(include=[np.number]).columns

        if len(numeric) == 0:
            return []

        # Prepare data for anomaly detection
        X = df[numeric].fillna(df[numeric].median())

        # Apply Isolation Forest
        iso_forest = IsolationForest(contamination=contamination, random_state=42)
        anomalies = iso_forest.fit_predict(X)

        # Identify anomalous records
        anomalous_indices = df.index[anomalies == -1].tolist()

        anomalies_info = []
        for idx in anomalous_indices[:10]:  # Top 10 anomalies
            record = df.loc[idx]
            anomalies_info.append({
                'index': idx,
                'unusual_values': {}
            })

            # Identify which variables contribute to the anomaly
            for col in numeric:
                value = record[col]
                if pd.notna(value):
                    percentile = stats.percentileofscore(df[col].dropna(), value)
                    if percentile > 95 or percentile < 5:
                        anomalies_info[-1]['unusual_values'][col] = {
                            'value': value,
                            'percentile': percentile
                        }

        self.detected_anomalies = anomalies_info
        return anomalies_info

    def create_automatic_predictive_model(self, df, target_variable):
        """
        Creates automatic predictive model for target variable
        """
        if target_variable not in df.columns:
            return None

        # Prepare features
        features = []
        for col in df.columns:
            if col != target_variable:
                if df[col].dtype in ['int64', 'float64']:
                    features.append(col)
                elif df[col].dtype == 'object' and df[col].nunique() < 50:
                    features.append(col)

        if len(features) == 0:
            return None

        # Prepare dataset
        X = df[features].copy()
        y = df[target_variable].copy()

        # Encode categorical variables
        label_encoders = {}
        for col in X.columns:
            if X[col].dtype == 'object':
                le = LabelEncoder()
                X[col] = le.fit_transform(X[col].astype(str))
                label_encoders[col] = le

        # Handle missing values
        X = X.fillna(X.median())
        y = y.fillna(y.median())

        # Split data
        X_train, X_test, y_train, y_test = train_test_split(
            X, y, test_size=0.2, random_state=42
        )

        # Train Random Forest model
        model = RandomForestRegressor(n_estimators=100, random_state=42)
        model.fit(X_train, y_train)

        # Evaluate model
        y_pred = model.predict(X_test)
        mae = mean_absolute_error(y_test, y_pred)
        r2 = r2_score(y_test, y_pred)

        # Feature importance
        importances = pd.DataFrame({
            'feature': features,
            'importance': model.feature_importances_
        }).sort_values('importance', ascending=False)

        model_result = {
            'model': model,
            'label_encoders': label_encoders,
            'features': features,
            'mae': mae,
            'r2': r2,
            'importances': importances,
            'accuracy_pct': max(0, (1 - mae/y.std()) * 100)
        }

        self.predictive_models[target_variable] = model_result
        return model_result

    def generate_automatic_insights(self, df, target_variables=None):
        """
        Generates complete automatic insights from dataset
        """
        complete_insights = []

        # Exploratory analysis
        exploratory_insights = self.automatic_exploratory_analysis(df)
        complete_insights.extend(exploratory_insights)

        # Important correlations
        correlations = self.detect_important_correlations(df)
        if correlations:
            complete_insights.append("\nIMPORTANT CORRELATIONS:")
            for corr in correlations[:5]:
                complete_insights.append(
                    f"• {corr['variable_1']} and {corr['variable_2']}: "
                    f"{corr['correlation']:.3f} ({corr['strength'].lower()})")

        # Anomalies
        anomalies = self.detect_anomalies(df)
        if anomalies:
            complete_insights.append(f"\nDETECTED ANOMALIES: {len(anomalies)} unusual records")

        # Predictive models
        if target_variables:
            complete_insights.append("\nPREDICTIVE MODELS:")
            for target_var in target_variables:
                if target_var in df.columns:
                    model_info = self.create_automatic_predictive_model(df, target_var)
                    if model_info:
                        complete_insights.append(
                            f"• {target_var}: Accuracy {model_info['accuracy_pct']:.1f}% "
                            f"(R² = {model_info['r2']:.3f})")

                        # Top 3 most important variables
                        top_vars = model_info['importances'].head(3)
                        for _, row in top_vars.iterrows():
                            complete_insights.append(
                                f"  - {row['feature']}: {row['importance']:.3f} importance")

        return "\n".join(complete_insights)

    def create_automatic_dashboard(self, df):
        """
        Creates automatic visual dashboard
        """
        numeric = df.select_dtypes(include=[np.number]).columns

        if len(numeric) < 2:
            print("Insufficient numeric variables to create dashboard")
            return

        fig, axes = plt.subplots(2, 2, figsize=(15, 12))

        # Distributions of main variables
        if len(numeric) >= 1:
            df[numeric[0]].hist(bins=30, ax=axes[0,0], alpha=0.7)
            axes[0,0].set_title(f'Distribution of {numeric[0]}')
            axes[0,0].set_xlabel(numeric[0])
            axes[0,0].set_ylabel('Frequency')

        # Correlations
        if len(numeric) >= 2:
            corr_matrix = df[numeric].corr()
            sns.heatmap(corr_matrix, annot=True, cmap='coolwarm', center=0, ax=axes[0,1])
            axes[0,1].set_title('Correlation Matrix')

        # Boxplot to detect outliers
        if len(numeric) >= 1:
            df[numeric[:5]].boxplot(ax=axes[1,0])
            axes[1,0].set_title('Outlier Detection')
            axes[1,0].tick_params(axis='x', rotation=45)

        # Time series if there's a date
        date_cols = [col for col in df.columns if 'date' in col.lower() or 'date' in col.lower()]
        if date_cols and len(numeric) >= 1:
            try:
                df_temp = df.copy()
                df_temp[date_cols[0]] = pd.to_datetime(df_temp[date_cols[0]])
                df_temp = df_temp.sort_values(date_cols[0])

                axes[1,1].plot(df_temp[date_cols[0]], df_temp[numeric[0]])
                axes[1,1].set_title(f'Temporal evolution of {numeric[0]}')
                axes[1,1].tick_params(axis='x', rotation=45)
            except:
                axes[1,1].text(0.5, 0.5, 'Could not create temporal chart',
                              ha='center', va='center', transform=axes[1,1].transAxes)

        plt.tight_layout()
        plt.show()
        return fig

# Usage example
np.random.seed(42)

# Create example dataset
example_df = pd.DataFrame({
    'date': pd.date_range('2023-01-01', periods=365),
    'sales': np.random.lognormal(mean=6, sigma=0.5, size=365),
    'customers': np.random.poisson(lam=50, size=365),
    'marketing_spend': np.random.normal(loc=1000, scale=200, size=365),
    'temperature': np.random.normal(loc=15, scale=10, size=365),
    'day_of_week': np.random.choice(['Monday', 'Tuesday', 'Wednesday', 'Thursday', 'Friday', 'Saturday', 'Sunday'], 365),
    'category': np.random.choice(['A', 'B', 'C'], 365)
})

# Introduce some correlations and anomalies
example_df.loc[50:100, 'sales'] *= 2  # Anomaly in sales
example_df['revenue'] = example_df['sales'] * 1.2 + np.random.normal(0, 50, 365)  # Correlation with sales

# Create analyzer
analyzer = AutomaticAnalyzer()

# Perform complete analysis
insights = analyzer.generate_automatic_insights(
    example_df,
    target_variables=['sales', 'revenue']
)

print("=== AUTOMATIC DATA ANALYSIS ===")
print(insights)

# Create dashboard
fig = analyzer.create_automatic_dashboard(example_df)
Tangible Benefits for Decision Making
The implementation of AI-based business intelligence for SMEs generates immediate and measurable benefits that transform the organization's decision-making capacity.
Speed in Decision Making
| Process | Manual Method | With Automated AI | Time Saved |
|---|---|---|---|
| Monthly sales analysis | 4-6 hours | 15-30 minutes | 85-90% |
| Customer segmentation | 2-3 days | 2-4 hours | 75-85% |
| Trend detection | 1-2 weeks | Real time | 95%+ |
| Profitability analysis | 1-2 days | 1-3 hours | 70-80% |
| Report preparation | 3-5 hours | 30-60 minutes | 80-90% |
Improved Accuracy and Reliability
- Elimination of 95% of human errors in calculations and analysis
- Automatic detection of data inconsistencies
- Automatic cross-validation between multiple sources
- Proactive alerts on anomalies or significant changes
- Automatic documentation of methodologies and assumptions
Democratization of Analysis
AI for Excel allows any manager or department head to perform sophisticated analysis without depending on technical specialists, accelerating decision-making throughout the organization.
- Intuitive interfaces that don't require advanced technical knowledge
- Automated analysis with natural language interpretation
- Reusable templates for recurring analysis
- Minimal training required for end users
- Scalability: from one user to the entire organization
Harvard Business Review (2024) reports that SMEs that democratize data analysis see a 31% increase in decision-making speed and a 27% improvement in employee satisfaction through greater analytical autonomy.
Accessible Tools for SMEs
The ecosystem of tools for tabular data analysis with AI has evolved toward solutions specifically designed for SMEs, combining analytical power with ease of use and affordable prices.
AI Extensions for Excel
| Tool | Provider | Monthly Price | Main Capabilities |
|---|---|---|---|
| Excel Copilot | Microsoft | €22-30 | Natural analysis, automatic charts |
| Sheets AI | €15-25 | Integrated ML, automatic predictions | |
| DataSnipper | DataSnipper | €50-100 | Audit and analysis automation |
| Ajelix | Ajelix | €10-30 | AI formulas, automatic visualizations |
| SheetGod | SheetGod | €8-20 | Automatic generation of complex formulas |
Business Intelligence Platforms
- Power BI (Microsoft): €10-20/user/month, perfect integration with Office
- Tableau Public: Free for public data, €75/month for enterprise
- Qlik Sense: €30-50/user/month, automatic data associations
- Looker Studio: Free for basic use, Google integration
- Metabase: Free open source, €85/month enterprise version
- Sisense: €2000-5000/month, ideal for complex data
No-Code/Low-Code Solutions
# Example of automatic analysis using simple Python libraries
import pandas as pd
import numpy as np
from sklearn.ensemble import RandomForestClassifier
from sklearn.model_selection import train_test_split
from sklearn.metrics import accuracy_score, classification_report
import matplotlib.pyplot as plt

class SimpleExcelAnalyzer:
    """
    Simplified class for Excel analysis that can be
    used by users with basic Python knowledge
    """

    def __init__(self, excel_file):
        """
        Initializes the analyzer with an Excel file
        """
        try:
            self.data = pd.read_excel(excel_file)
            print(f"✅ File loaded: {len(self.data)} rows, {len(self.data.columns)} columns")
            print(f"Available columns: {list(self.data.columns)}")
        except Exception as e:
            print(f"❌ Error loading file: {e}")
            self.data = None

    def automatic_summary(self):
        """
        Generates automatic data summary
        """
        if self.data is None:
            return "No data loaded"

        summary = "\n=== AUTOMATIC SUMMARY ==="

        # Basic information
        summary += f"\nRows: {len(self.data):,}"
        summary += f"\nColumns: {len(self.data.columns)}"

        # Data types
        numeric = self.data.select_dtypes(include=[np.number]).columns.tolist()
        text = self.data.select_dtypes(include=['object']).columns.tolist()

        summary += f"\nNumeric variables: {len(numeric)}"
        summary += f"\nText variables: {len(text)}"

        # Missing values
        missing = self.data.isnull().sum()
        if missing.sum() > 0:
            summary += "\n\nMissing values:"
            for col, count in missing[missing > 0].items():
                pct = (count / len(self.data)) * 100
                summary += f"\n  • {col}: {count} ({pct:.1f}%)"

        # Basic statistics for numeric variables
        if numeric:
            summary += "\n\nNumeric variable statistics:"
            for col in numeric[:3]:  # Only first 3
                stats = self.data[col].describe()
                summary += f"\n  • {col}: Average {stats['mean']:.2f}, Range {stats['min']:.2f} - {stats['max']:.2f}"

        return summary

    def find_correlations(self, threshold=0.5):
        """
        Finds important correlations between variables
        """
        numeric = self.data.select_dtypes(include=[np.number]).columns

        if len(numeric) < 2:
            return "Not enough numeric variables to calculate correlations"

        correlations = self.data[numeric].corr()

        # Search for strong correlations
        results = "\n=== IMPORTANT CORRELATIONS ==="
        found = False

        for i in range(len(correlations.columns)):
            for j in range(i+1, len(correlations.columns)):
                var1 = correlations.columns[i]
                var2 = correlations.columns[j]
                corr_val = correlations.iloc[i, j]

                if abs(corr_val) >= threshold:
                    found = True
                    direction = "positive" if corr_val > 0 else "negative"
                    strength = "very strong" if abs(corr_val) >= 0.8 else "strong"
                    results += f"\n• {var1} and {var2}: {corr_val:.3f} ({direction} {strength} correlation)"

        if not found:
            results += f"\nNo correlations above {threshold} found"

        return results

    def predict_variable(self, target, use_all_variables=True):
        """
        Creates simple predictive model for a target variable
        """
        if target not in self.data.columns:
            return f"Variable '{target}' does not exist in the data"

        # Prepare data
        if use_all_variables:
            # Use all numeric variables except the target
            features = self.data.select_dtypes(include=[np.number]).columns.tolist()
            if target in features:
                features.remove(target)
        else:
            # User can specify which variables to use
            features = []  # Logic for manual selection would be implemented

        if len(features) == 0:
            return "No predictor variables available"

        # Clean data
        clean_data = self.data[features + [target]].dropna()

        if len(clean_data) < 50:
            return "Insufficient data to create predictive model"

        X = clean_data[features]
        y = clean_data[target]

        # Split data
        X_train, X_test, y_train, y_test = train_test_split(
            X, y, test_size=0.2, random_state=42
        )

        # Train simple model
        model = RandomForestClassifier(n_estimators=50, random_state=42)
        model.fit(X_train, y_train)

        # Evaluate
        y_pred = model.predict(X_test)
        accuracy = accuracy_score(y_test, y_pred)

        # Variable importance
        importances = pd.DataFrame({
            'variable': features,
            'importance': model.feature_importances_
        }).sort_values('importance', ascending=False)

        result = f"\n=== PREDICTIVE MODEL FOR '{target}' ==="
        result += f"\nModel accuracy: {accuracy:.1%}"
        result += "\nMost important variables:"

        for _, row in importances.head(5).iterrows():
            result += f"\n  • {row['variable']}: {row['importance']:.3f}"

        if accuracy > 0.7:
            result += "\n\n✅ Model has good accuracy for predictions"
        elif accuracy > 0.5:
            result += "\n\n⚠️ Model has moderate accuracy, use with caution"
        else:
            result += "\n\n❌ Model has low accuracy, review data or variables"

        return result

    def create_automatic_charts(self):
        """
        Creates automatic data charts
        """
        numeric = self.data.select_dtypes(include=[np.number]).columns.tolist()

        if len(numeric) == 0:
            print("No numeric variables to chart")
            return

        # Determine chart layout
        num_charts = min(4, len(numeric))
        if num_charts == 1:
            fig, axes = plt.subplots(1, 1, figsize=(8, 6))
            axes = [axes]
        elif num_charts == 2:
            fig, axes = plt.subplots(1, 2, figsize=(12, 5))
        else:
            fig, axes = plt.subplots(2, 2, figsize=(12, 10))
            axes = axes.flatten()

        # Create charts
        for i, col in enumerate(numeric[:num_charts]):
            # Histogram
            self.data[col].hist(bins=20, ax=axes[i], alpha=0.7)
            axes[i].set_title(f'Distribution of {col}')
            axes[i].set_xlabel(col)
            axes[i].set_ylabel('Frequency')

            # Add statistics to chart
            mean = self.data[col].mean()
            median = self.data[col].median()
            axes[i].axvline(mean, color='red', linestyle='--', label=f'Mean: {mean:.2f}')
            axes[i].axvline(median, color='green', linestyle='--', label=f'Median: {median:.2f}')
            axes[i].legend()

        plt.tight_layout()
        plt.show()

        return fig

    def complete_analysis(self):
        """
        Executes complete automatic analysis
        """
        if self.data is None:
            return "No data to analyze"

        print(self.automatic_summary())
        print(self.find_correlations())

        # Try to create predictive model for first numeric variable
        numeric = self.data.select_dtypes(include=[np.number]).columns.tolist()
        if numeric:
            print(self.predict_variable(numeric[0]))

        # Create charts
        self.create_automatic_charts()

        return "Complete analysis finished"

# Simplified usage example
if __name__ == "__main__":
    # Create example data and save as Excel
    example_data = pd.DataFrame({
        'sales': np.random.normal(1000, 200, 300),
        'marketing': np.random.normal(500, 100, 300),
        'customers': np.random.poisson(50, 300),
        'satisfaction': np.random.choice(['High', 'Medium', 'Low'], 300),
        'month': np.random.choice(range(1, 13), 300)
    })

    example_data.to_excel('analysis_example.xlsx', index=False)

    # Use the simple analyzer
    analyzer = SimpleExcelAnalyzer('analysis_example.xlsx')
    result = analyzer.complete_analysis()

    print("\n" + "="*50)
    print("USAGE EXAMPLE COMPLETED")
    print("="*50)
Real Use Cases by Department
Each department of an SME can leverage tabular data analysis to optimize their specific operations, from sales to human resources.
Sales and Marketing
- Sales funnel analysis: identify where leads are lost
- Automatic lead scoring based on historical behavior
- Price optimization by segment and product
- Multi-channel campaign effectiveness analysis
- Customer churn prediction with 2-3 months anticipation
- Automatic offer personalization by customer profile
Operations and Logistics
- Distribution route optimization based on historical data
- Inventory demand prediction by SKU and location
- Operational efficiency analysis by process and employee
- Production chain bottleneck detection
- Stock level optimization to minimize storage costs
Finance and Accounting
- Cash flow prediction with 90-day precision
- Automatic profitability analysis by customer and product
- Expense anomaly detection and suspicious transaction identification
- Credit terms optimization based on default risk
- Financial reporting and executive KPI automation
Step-by-Step Implementation
Transformation toward data-driven decisions requires a structured approach that minimizes risks while maximizing organizational learning.
Week 1-2: Data Audit
- Map all existing data sources (Excel, CRM, ERP, web analytics)
- Evaluate quality, completeness, and update frequency
- Identify critical data for key business decisions
- Document current analysis and reporting processes
- Establish baseline of time invested in manual analysis
Week 3-4: First Pilot Project
- Select a specific analysis that is done monthly
- Implement basic automation using existing tools
- Compare automatic results vs manual analysis
- Measure time saved and additional insights discovered
- Document lessons learned and next steps
Week 5-8: Departmental Scaling
- Expand automation to 3-5 recurring analyses
- Train key users in selected tools
- Establish validation and quality control processes
- Create automatically updated departmental dashboards
- Implement automatic alerts for critical metrics
Week 9-12: Enterprise Integration
- Connect data between departments for cross-analysis
- Develop predictive models for strategic decisions
- Establish data-driven decision-making culture
- Create automated executive reporting
- Plan evolution toward more advanced AI capabilities
ROI and Investment Justification
Investment in automated tabular data analysis generates measurable returns that justify both initial investment and continuous evolution of analytical capabilities.
Time and Resource Savings
| Activity | Manual Time | Automated Time | Monthly Savings | Economic Value |
|---|---|---|---|---|
| Sales report | 8 hours | 30 minutes | 7.5 hours | €225 |
| Customer analysis | 12 hours | 2 hours | 10 hours | €300 |
| KPI tracking | 6 hours | 15 minutes | 5.75 hours | €172 |
| Profitability analysis | 16 hours | 3 hours | 13 hours | €390 |
| Anomaly detection | 4 hours | Automatic | 4 hours | €120 |
Total monthly savings: 40.25 hours valued at €1,207, equivalent to €14,484 annually for a typical SME.
Business Decision Improvements
- 15-25% increase in demand prediction accuracy
- 30-40% reduction in market change response time
- 20-30% improvement in marketing campaign effectiveness
- 10-15% increase in customer satisfaction through better service
- 25-35% reduction in operational costs through detected optimizations
Typical ROI for SMEs: 300-500% in the first year, considering time savings, decision improvements, and new revenue opportunities identified through automated analysis.
Common Mistakes and How to Avoid Them
Successful implementation requires avoiding typical mistakes that can compromise results or generate distrust in automated systems.
Mistake 1: Poor Data Quality
Problem: Implementing AI on dirty or inconsistent data. Solution: Invest initial time in cleaning and establish continuous validation processes.
Mistake 2: Unrealistic Automation Expectations
- Problem: Expecting 100% automation from day one
- Reality: Effective automation is a gradual 6-12 month process
- Solution: Set progressive objectives and celebrate small achievements
- Reasonable goal: 70-80% of analyses automated by end of first year
Mistake 3: Resistance to Change
Team resistance is one of the biggest obstacles. The solution includes early training, involving users in solution design, and demonstrating immediate value rather than threatening jobs.
The Future: Toward the Intelligent Enterprise
SMEs that master tabular data analysis lay the foundation to evolve toward truly intelligent enterprises, where AI guides strategic decisions in real time.
Natural Evolution of Capabilities
| Stage | Timeframe | Capabilities | Expected ROI |
|---|---|---|---|
| Basic | 0-6 months | Report automation, dashboards | 200-300% |
| Intermediate | 6-12 months | Predictive models, AI segmentation | 300-400% |
| Advanced | 12-24 months | Real-time optimization, intelligent alerts | 400-500% |
| Expert | 24+ months | Conversational AI, autonomous decisions | 500%+ |
Emerging Technologies
- Conversational AI for natural language analysis
- Robotic Process Automation (RPA) integrated with AI
- Edge computing for real-time analysis
- Blockchain for data traceability and trust
- Augmented reality for immersive data visualization
Conclusion: Your Data Is Your Competitive Advantage
Every Excel sheet, every sales record, every customer interaction that your SME has collected over the years represents a gold mine of business intelligence waiting to be exploited. The difference between companies that thrive and those that struggle often comes down to their ability to convert data into intelligent decisions.
AI for tabular data analysis is no longer a futuristic advantage: it's a present necessity. The tools are mature, costs are accessible, and benefits are immediate. Every day that passes without automating your data analysis is a lost opportunity for optimization, growth, and competitive advantage.
Successful digital transformation doesn't require revolution: it requires systematic evolution. Start with an analysis, automate a report, implement a dashboard. Each small step toward automated intelligence multiplies your capacity to make informed and quick decisions.
The time to act is now: open your most important Excel sheet, identify the analysis you do every month, and automate it with the tools we've discussed. In 30 days, you'll have your first business intelligence system running. Your future decisions will thank you.